Lorem ipsum dolor sit amet, consectetur adipiscing elit lobortis arcu enim urna adipiscing praesent velit viverra sit semper lorem eu cursus vel hendrerit elementum morbi curabitur etiam nibh justo, lorem aliquet donec sed sit mi dignissim at ante massa mattis.
Vitae congue eu consequat ac felis placerat vestibulum lectus mauris ultrices cursus sit amet dictum sit amet justo donec enim diam porttitor lacus luctus accumsan tortor posuere praesent tristique magna sit amet purus gravida quis blandit turpis.
At risus viverra adipiscing at in tellus integer feugiat nisl pretium fusce id velit ut tortor sagittis orci a scelerisque purus semper eget at lectus urna duis convallis. porta nibh venenatis cras sed felis eget neque laoreet suspendisse interdum consectetur libero id faucibus nisl donec pretium vulputate sapien nec sagittis aliquam nunc lobortis mattis aliquam faucibus purus in.
Nisi quis eleifend quam adipiscing vitae aliquet bibendum enim facilisis gravida neque. Velit euismod in pellentesque massa placerat volutpat lacus laoreet non curabitur gravida odio aenean sed adipiscing diam donec adipiscing tristique risus. amet est placerat in egestas erat imperdiet sed euismod nisi.
“Nisi quis eleifend quam adipiscing vitae aliquet bibendum enim facilisis gravida neque velit euismod in pellentesque massa placerat”
Eget lorem dolor sed viverra ipsum nunc aliquet bibendum felis donec et odio pellentesque diam volutpat commodo sed egestas aliquam sem fringilla ut morbi tincidunt augue interdum velit euismod eu tincidunt tortor aliquam nulla facilisi aenean sed adipiscing diam donec adipiscing ut lectus arcu bibendum at varius vel pharetra nibh venenatis cras sed felis eget dolor cosnectur drolo.
Picture this: a factory floor buzzing with activity, machines whirring and workers dashing from place to another. Amidst all the hustle and bustle, there is a quiet little metric silently watching over everything. The guardian angel of manufacturing, keeping a watchful eye on the efficiency of the entire production process. It is OEE, the Overall Equipment Effectiveness!
OEE is the superhero when it comes to boosting productivity and reducing downtime. By measuring the availability of performance, and quality of equipment, OEE can help to identify areas of improvement and make a company’s operations more efficient.
OEE is like a personal coach for your manufacturing process - always pushing your company to be its best and achieve peak performance.
OEE (Overall Equipment Effectiveness) is a powerful metric that measures the percentage of planned production time in which a line is truly productive.
Originally it was designed to support Total Productive Maintenance (TPM) initiatives (learn more about TPM here) to track the progress in achieving the elusive goal of a ‘perfect production’. A perfect score of 100% would mean that every minute of production time was utilised efficiently, no stoppages, no quality issues.
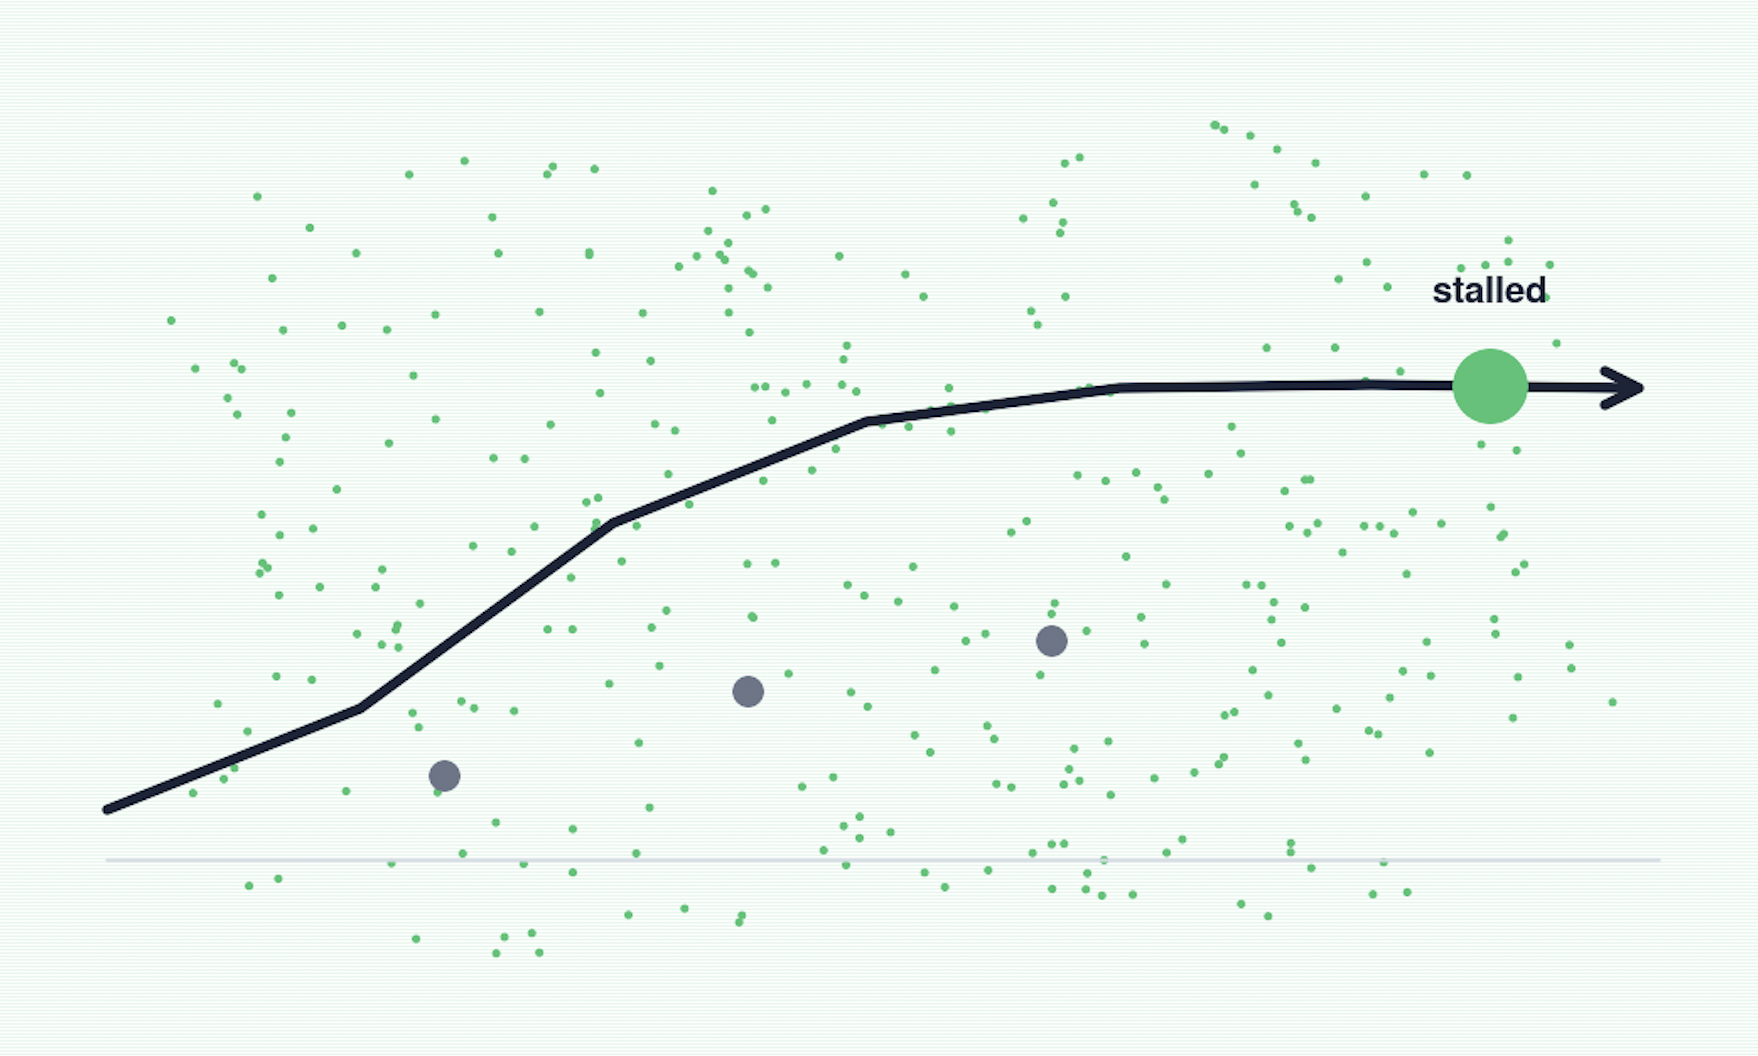
But we all know that this is impossible to achieve, so an OEE score of 85% is already considered to be world-class while typical companies achieve 60%. Manufacturing companies that are just starting with TPM or lean programs see scores as low as 40%.
OEE is made up of three components, while each of these components corresponds to one of the TPM goals that were already discussed here. They account for different types of productivity losses, such as equipment downtime, reduced speed and defects. By identifying these losses and their causes, OEE allows manufacturers to improve their processes and achieve greater efficiency.
The mentioned components, the TPM goal and the respective type of productivity loss is displayed in the following list:
Availability losses include all events that stop planned production for a certain length of time. Examples include planned stops (changeovers etc.) and unplanned stops (breakdowns, malfunctions etc.)
Quality takes quality losses into account. Manufactured pieces that do not meet quality standards are losses that are being considered here. Examples are production rejects and reduced yield during startup.
Performance losses are taken into account. All factors that cause production to operate at less than the maximum speed are included. Examples include slow cycles and small stops.
Calculating OEE is not hard. Matter of fact, the formula to calculate OEE is rather easy.
OEE can be calculated the following way:
OEE = Availability x Performance x Quality
With all these three components being calculated fairly easily:
Availability = Runtime/Planned Time, Performance = (Ideal time x cycle count)/Runtime, Quality = Good count/Total count
But tracking all these times and counts while being stressed in production is not easy. With automating the tracking of these, one is assured to have all the correct information. We at Stryza can help achieve this. Just book an appointment and we can advise you on your specific use-case.
The previously mentioned losses (Quality, Performance & Availability) can be further broken down into the six big losses which can be seen as the most common causes of lost productivity in manufacturing organisations.
They are displayed in the list below:
Availability:
Performance:
Quality:
Stryza is a connected worker platform that is able to boost your OEE significantly. Stryza is able to do this in a number of ways:
Overall, by combining the concept of OEE with Stryza, manufacturers can gain greater visibility into their production process, identify areas for improvement, and take steps to optimise their operations, ultimately improving their OEE and bottom line.
Book a free demo of our application and see how it can take your manufacturing operations to the next level.


.jpg)